
An infographic giving ratings on Christchurch City Councillors.
An infographic showing the layout of AMI Stadium.

An infographic listing the ten global cities to watch.
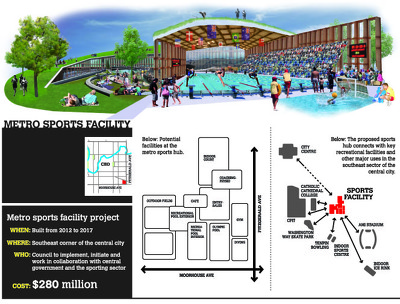
An infographic showing the proposed Metro Sports Facility.
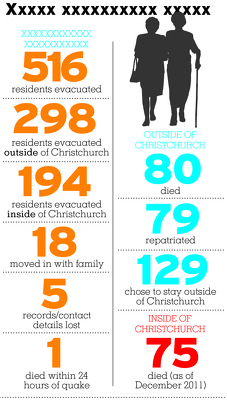
An incomplete infographic giving statistics about rest-home residents.

An infographic illustrating an accountability scorecard given to CERA.
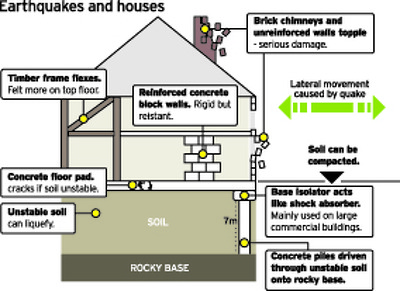
An infographic about the effects of earthquakes on houses.

An infographic detailing pay rises received by Tony Marryatt.
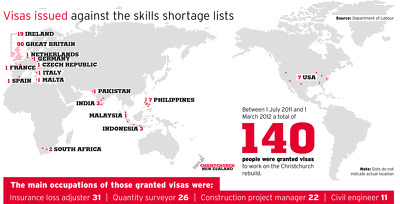
An infographic giving statistics about visas granted to rebuild workers.

An incomplete infographic showing the location and magnitude of aftershocks.
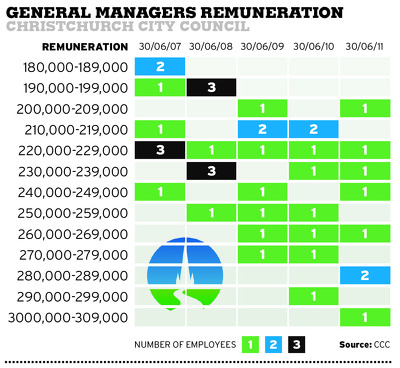
An infographic showing the salaries of Christchurch City Council managers.
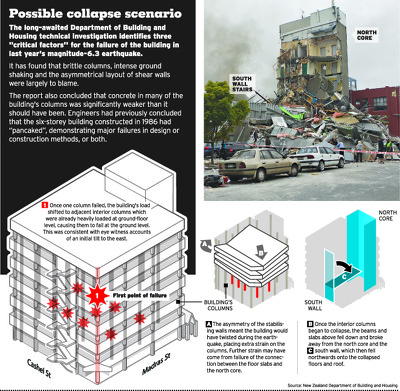
An infographic describing the collapse of the CTV building.

An infographic showing a design for earthquake-proofing houses.

An infographic showing changes in visitor numbers across Canterbury.

An uncompleted infographic about cruise ship visits to Christchurch.

An infographic showing inflation for the March 2011 quarter.
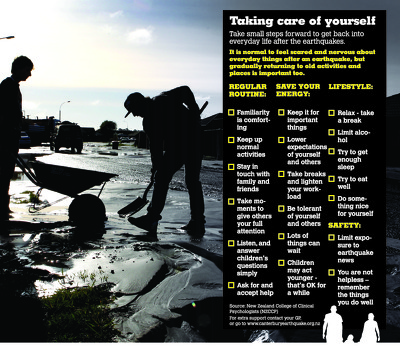
An infographic giving tips on dealing with earthquake-related stress.

An infographic illustrating an email from the Director of Boxpark.

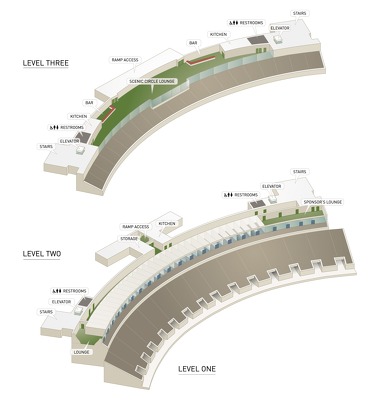
An infographic giving details of a proposed transport hub.

An infographic listing recommendations of a report on masonry.

An infographic about the opening of Re:Start mall.

An infographic giving details of the 2011 Santa Parade.

An infographic charting aftershocks on 8 and 9 September.

An infographic showing the status of houses in Southshore.

An infographic showing the location of closed businesses in Northlands Mall.
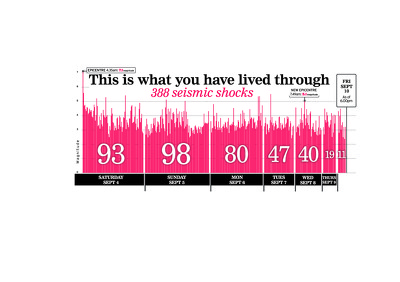
An infographic charting aftershocks from 4 September to 10 September.
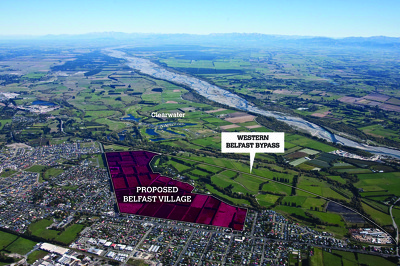
An infographic showing the location of the proposed Belfast village.

An infographic showing areas of Kaiapoi likely to be abandoned.

An infographic showing the planned revamp of Rugby League Park.

An infographic giving details of the Canterbury A&P Show.