

Search
found 113 results
Images for Geology--New Zealand--Canterbury; more images...

The Porters Pass fault
Research papers, University of Canterbury Library
A zone of active tectonism occurs in mid and north Canterbury, from the Rakaia to the Waipara Rivers, which coincides with seismicity concentrations and several Quaternary surface anomalies and is here defined as the Porters Pass Tectonic Zone. Although parallel to the Marlborough faults to the north, the lack of regional definition suggests this zone is much younger in its inception reflecting a southward movement of the plate rotation vector. The objectives of this study were to map the structures associated with this zone in the segment between the Rakaia and Waimakariri Rivers with detailed analysis concentrated in the upper Kawai Valley. Quaternary offsets on the main lineament of the Porters Pass Fault were traced through the area and evidence for the rate of movement, probable magnitudes and return periods of related seismic events was sought. The basement was found to be complicated by pre-existing deformation structures in Torlesse Group rocks which have been subsequently been re-activated or rotated by recent fault movement probably beginning in the Pleistocene. This phase is dominantly thrusting and uplift has lead to the erosion of most of the overlying sedimentary cover. Remnants of the Cret-Tertiary sediments still remain as fault-bounded packets. Evidence suggests that a change to development of a regional lateral shear associated with the Porters Pass Tectonic Zone transects the thrust system with complex interaction between the older reverse and new strike-slip faults. Offset rates along the segments of the Porters Pass Fault are not well constrained but are believed to be approximately in the range of 11-13 mm/year for at least the last 130,000 years. This rate is similar to other large faults in the Marlborough region. Two earthquake events have been identified and dated at 600 and 2000 years ago, with a magnitude of greater than 6.5. Evidence suggests characteristic earthquakes along the Porters Pass Fault are greater than Magnitude 7. This result has some major ramifications for the expected seismic hazards for nearby Christchurch.
A geology-based 3D seismic velocity model of Canterbury, New Zealand
Research papers, University of Canterbury Library
This paper presents a seismic velocity model of Canterbury, New Zealand based on 3D geologic surfaces and velocities from a range of data sources. The model provides the 3D crustal structure in the region at multiple length scales for seismic wave propagation simulations, such as broadband ground motion and shallow site response analyses related to understanding the ground motions and site responses during the 2010- 2011 Canterbury earthquakes. Pre-Quaternary geologic horizons are calculated based on the reinterpretation of a comprehensive network of seismic reflection surveys from seven different campaigns over the past 50 years, as well as point constraints across an array of petroleum industry drill holes. Particular attention is given to a detailed representation of Quaternary stratigraphy, representing shallow (z<250m) near-surface layers in the model. Seismic velocities are obtained from seismic reflection processing (for Vp) and also recently performed active and passive surface wave analyses (for Vs). Over 1,700 water wells in the region are used to constrain the complex inter-bedded Quaternary stratigraphy (gravels, sands, silts, organics etc.) near the coastline, including beneath urban Christchurch, which has resulted from fluvial deposition and marine regression and transgression. For the near-surface Springston and Christchurch Formations in the Christchurch urban area (z<50m), high-spatial resolution seismic velocities (including Vs30 ) were obtained from over 13,000 cone penetration tests combined with a recently developed CPT-Vs correlation.
Development of a 3D High-Resolution Velocity Model of the Canterbury, New …
Research papers, University of Canterbury Library
A 3D high-resolution model of the geologic structure and associated seismic velocities in the Canterbury, New Zealand region is developed utilising data from depthconverted seismic reflection lines, petroleum and water well logs, cone penetration tests, and implicitly guided by existing contour maps and geologic cross sections in data sparse subregions. The model, developed using geostatistical Kriging, explicitly represents the significant and regionally recognisable geologic surfaces that mark the boundaries between geologic units with distinct lithology and age. The model is examined in the form of both geologic surface elevation contour maps as well as vertical cross sections of shear wave velocity, with the most prominent features being the Banks Peninsula Miocene-Pliocene volcanic edifice, and the Pegasus and Rakaia late Mesozoic-Neogene sedimentary basins. The adequacy of the modelled geologic surfaces is assessed through a residual analysis of point constraints used in the Kriging and qualitative comparisons with previous geologic models of subsets of the region. Seismic velocities for the lithological units between the geologic surfaces have also been derived, thus providing the necessary information for a Canterbury velocity model (CantVM) for use in physics-based seismic wave propagation. The developed model also has application for the determination of depths to specified shear wave velocities for use in empirical ground motion modelling, which is explicitly discussed via an example.
Julian's blog
Other, National Library of New Zealand
Blog of Julian, educational outreach facilitator at GNS Science. Includes information on GNS Science field trips; explanations of New Zealand geology; video clips; and sections on the Christchurch earthquakes, and New Zealand fossils.
Kia Kaha Canterbury
Articles, UC QuakeStudies
A blog post from US Ambassador to New Zealand and Samoa, David Huebner, titled, "Kia Kaha Canterbury".
Exploring the UNESCO Geopark concept as a pathway to a geotourism attracti…
Research papers, Lincoln University
The concept of geoparks was first introduced in the first international conference on geoparks held in China in 2004. Here in New Zealand, Kiwis are accustomed to national parks, land reserves, marine reserves, and urban cities and regional parks. The concept of these protected areas has been long-standing in the country, whereas the UNESCO concept of geoparks is still novel and yet to be established in New Zealand. In this dissertation, I explored the geopark concept for better understanding of its merits and examined the benefits of geotourism attractions as a sustainable economic development strategy to retrieve a declining rural economy. This research is focused on Kaikoura as a case study with geological significance, and emphasizes pre-earthquake existing geological heritages and new existing geological heritages post-earthquake to determine whether the geopark concept is appropriate and what planning framework is available to process this concept proposal should Kaikoura be interested in future.
Rebuild the future Christchurch
Other, National Library of New Zealand
Provides news and information to residents of Canterbury after the 2010 and 2011 earthquakes. Includes ideas discussion page, blog, services directory, list of damaged suburbs, geological information including recent aftershocks, and photos.
Borehole Sediment Samples: Canterbury Museum
Images, Canterbury Museum
Eight white corflute boxes of sediment samples from the borehole drilled adjacent to the Canterbury Museum Rolleston Avenue facade following the 22 February 2011 earthquake. Project number 52160, Bore hole BH02 These sediment samples are from machine drilled borings taken from the land near the Rolleston Avenue facade of Canterbury Museum. The ...
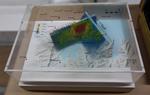
3-D Model: Port Hills Faults
Images, Canterbury Museum
One oblong perspex covered 3-D model of the fault plains that ruptured to cause the 22 February and 13 June 2011 earthquakes; top of the model also acts as a map overlay. This model provides a visual demonstration of the geological forces that caused the 22 February and 13 June 2011 earthquakes. These forces were so strong that parts of the Por...
A 3D seismic velocity model for Canterbury, New Zealand for broadband grou…
Research papers, University of Canterbury Library
This poster presents the on-going development of a new 3D seismic velocity model of Canterbury, New Zealand. The intention of the model is to provide the 3D crustal structure in the region at multiple length scales for seismic wave propagation simulations, both broadband ground motion and more localized shallow site response analyses.
2010 Canterbury earthquake : from Wikipedia, the free encyclopedia.
Other, National Library of New Zealand
Provides a map, the geological background, describes the effects, both in Christchurch and its surrounding areas, the damage to notable buildings, the financial exposure, the emergency response and relief efforts and the media coverage of the earthquake.
Science - Earth Science
Audio, Radio New Zealand
Erosion to earthquakes with geologist and paleontologist Dr Hamish Campbell from GNS science. Chatham Islands geology and it's links with Christchurch and Canterbury.
Development of realistic Vs profiles in Christchurch, New Zealand, via act…
Research papers, University of Canterbury Library
Deep shear wave velocity (Vs) profiles (>400 m) were developed at 14 sites throughout Christchurch, New Zealand using surface wave methods. This paper focuses on the inversion of surface wave data collected at one of these sites, Hagley Park. This site is located on the deep soils of the Canterbury Plains, which consist of alluvial gravels inter-bedded with estuarine and marine sands, silts, clays and peats. Consequently, significant velocity contrasts exist at the interface between geologic formations. In order to develop realistic velocity models in this complex geologic environment, a-priori geotechnical and geologic data were used to identify the boundaries between geologic formations. This information aided in developing the layering for the inversion parameters. Moreover, empirical reference Vs profiles based on material type and confining pressure were used to develop realistic Vs ranges for each layer. Both the a-priori layering information and the reference Vs curves proved to be instrumental in generating realistic velocity models that account for the complex inter-bedded geology in the Canterbury Plains.
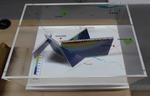
3-D Model: Greendale and Associated Faults
Images, Canterbury Museum
One oblong perspex covered 3-D model of the fault plains associated with the 4 September 2010 Darfield earthquake; top of the model also acts as a map overlay. Geologists continue to study the 4 September 2010 earthquake and consider it is likely to have been a complex event with several faults rupturing simultaneously. This model provides one ...
Castle Rock scarred
Images, eqnz.chch.2010
The magnitude 7.1 Christchurch earthquake broke off an enormous chunk of Castle Rock in the Port Hills which has tumbled down towards the Lyttelton tunnel. View from Morgan's Valley (-43.578037° 172.714828°).
2011 Christchurch earthquake.
Other, National Library of New Zealand
Provides a map, the geological background, describes the effects, both in Christchurch and its surrounding areas, the damage to notable buildings, the financial exposure, the emergency response and relief efforts and the media coverage of the earthquake.
Preliminary geometry and kinematics of multiple surface ruptures during th…
Research papers, University of Canterbury Library
The Mw 7.8 Kaikōura earthquake ruptured ~200 km at the ground surface across the New Zealand plate boundary zone in the northern South Island. This study was conducted in an area of ~600 km2 in the epicentral region where the faults comprise two main non-coplanar sets that strike E-NE and NNE-NW with mainly steep dips (60о-80°). Analysis of the surface rupture using field and LiDAR data provides new information on the dimensions, geometries and kinematics of these faults which was not previously available from pre-earthquake active faults or bedrock structure. The more northerly striking fault set are sub-parallel to basement bedding and accommodated predominantly left-lateral reverse slip with net slips of ~1 and ~5 m for the Stone Jug and Leader faults, respectively. The E-NE striking Conway-Charwell and The Humps faults accrued right-lateral to oblique reverse with net slips of ~2 and ~3 m, respectively. The faults form a hard-linked system dominated by kinematics consistent with the ~260° trend of the relative plate motion vector and the transpressional structures recorded across the plate boundary in the NE South Island. Interaction and intersection of the main fault sets facilitated propagation of the earthquake and transfer of slip northwards across the plate boundary zone.
Mark Quiqley
Audio, Radio New Zealand
Dr. Mark Quiqley is Senior Lecturer in Active Tectonics and Geomorphology in the Department of Geological Sciences at the University of Canterbury. He is part of the team involved in the scientific response to the Canterbury earthquake and has been monitoring it from the air.
Fault rupture patterns during the Mw7.8 2016 Kaikoura Earthquake in the re…
Research papers, University of Canterbury Library
Surface rupture and slip from the Mw 7.8 2016 Kaikōura Earthquake have been mapped in the region between the Leader and Charwell rivers using field mapping and LiDAR data. The eastern Humps, north Leader and Conway-Charwell faults ruptured the ground surface in the study area. The E-NE striking ‘The Humps’ Fault runs along the base of the Mt Stewart range front, appears to dip steeply NW and intersects the NNW-NNE Leader Fault which itself terminates northwards at the NE striking Conway-Charwell Fault. The eastern Humps Fault is up to the NW and accommodates oblique slip with reverse and right lateral displacement. Net slip on ‘The Humps’ Fault is ≤4 m and produced ≤4 m uplift of the Mt Stewart range during the earthquake. The Leader Fault strikes NNW-NNE with dips ranging from ~10° west to 80° east and accommodated ≤4 m net slip comprising left-lateral and up-to-the-west vertical displacement. Like the Humps west of the study area, surface-rupture of the Leader Fault occurred on multiple strands. The complexity of rupture on the Leader Fault is in part due to the occurrence of bedding-parallel slip within the Cretaceous-Cenozoic sequence. Although the Mt Stewart range front is bounded by ‘The Humps’ Fault, in the study area neither this fault nor the Leader Fault were known to have been active before the earthquake. Fieldwork and trenching investigations are ongoing to characterise the geometry, kinematics and paleoseismic history of the mapped active faults.
Liquefaction problems
Audio, Radio New Zealand
Sue Holmes, resident of Seabreeze Close in Bexley, which was built on reclaimed land which has liquefied after the Canterbury earthquake; Dr Tom Wilson, lecturer in Hazard and Disaster Management, from the department of Geological Sciences, Canterbury University; and Bob Parker, Mayor of Christchurch.
Warnings sounded over NZ's Transport resilience
Audio, Radio New Zealand
The New Zealand Shipping Federation says the government needs to take the resilience of ports seriously as the Kaikoura earthquake has shown the vulnerability of roading - and consider what their role is when auditing them. Annabel Young is the Executive Director of the NZ Shipping Federation. Canterbury University Professor of Geological Sciences Tim Davies, says improving and increasing the transport network through coastal shipping is essential.
Geologic and geomorphic influence on the spatial extent of lateral spreadi…
Research papers, University of Canterbury Library
Liquefaction-induced lateral spreading during earthquakes poses a significant hazard to the built environment, as observed in Christchurch during the 2010 to 2011 Canterbury Earthquake Sequence (CES). It is critical that geotechnical earthquake engineers are able to adequately predict both the spatial extent of lateral spreads and magnitudes of associated ground movements for design purposes. Published empirical and semi-empirical models for predicting lateral spread displacements have been shown to vary by a factor of <0.5 to >2 from those measured in parts of Christchurch during CES. Comprehensive post- CES lateral spreading studies have clearly indicated that the spatial distribution of the horizontal displacements and extent of lateral spreading along the Avon River in eastern Christchurch were strongly influenced by geologic, stratigraphic and topographic features.
Rethinking PSHA
Research papers, University of Canterbury Library
Since the early 1980s seismic hazard assessment in New Zealand has been based on Probabilistic Seismic Hazard Analysis (PSHA). The most recent version of the New Zealand National Seismic Hazard Model, a PSHA model, was published by Stirling et al, in 2012. This model follows standard PSHA principals and combines a nation-wide model of active faults with a gridded point-source model based on the earthquake catalogue since 1840. These models are coupled with the ground-motion prediction equation of McVerry et al (2006). Additionally, we have developed a time-dependent clustering-based PSHA model for the Canterbury region (Gerstenberger et al, 2014) in response to the Canterbury earthquake sequence. We are now in the process of revising that national model. In this process we are investigating several of the fundamental assumptions in traditional PSHA and in how we modelled hazard in the past. For this project, we have three main focuses: 1) how do we design an optimal combination of multiple sources of information to produce the best forecast of earthquake rates in the next 50 years: can we improve upon a simple hybrid of fault sources and background sources, and can we better handle the uncertainties in the data and models (e.g., fault segmentation, frequency-magnitude distributions, time-dependence & clustering, low strain-rate areas, and subduction zone modelling)? 2) developing revised and new ground-motion predictions models including better capturing of epistemic uncertainty – a key focus in this work is developing a new strong ground motion catalogue for model development; and 3) how can we best quantify if changes we have made in our modelling are truly improvements? Throughout this process we are working toward incorporating numerical modelling results from physics based synthetic seismicity and ground-motion models.
Our Changing World - Christchurch Earthquake Geology
Audio, Radio New Zealand
University of Canterbury geologist Mark Quigley has earned a reputation for being a great science communicator on the subject of earthquakes. But when he's not in the media spotlight, he's out and about around Canterbury building a picture of the region's tectonic history, and trying to understand what might happen in the future.
sand volcano
Images, eqnz.chch.2010
None
sand volcano
Images, eqnz.chch.2010
None
sand volcano
Images, eqnz.chch.2010
None
sand volcano
Images, eqnz.chch.2010
None
sand volcano
Images, eqnz.chch.2010
None
Strike-slip ground-surface rupture (Greendale Fault) associated with the 4…
Research papers, University of Canterbury Library
This paper provides a photographic tour of the ground-surface rupture features of the Greendale Fault, formed during the 4th September 2010 Darfield Earthquake. The fault, previously unknown, produced at least 29.5 km of strike-slip surface deformation of right-lateral (dextral) sense. Deformation, spread over a zone between 30 and 300 m wide, consisted mostly of horizontal flexure with subsidiary discrete shears, the latter only prominent where overall displacement across the zone exceeded about 1.5 m. A remarkable feature of this event was its location in an intensively farmed landscape, where a multitude of straight markers, such as fences, roads and ditches, allowed precise measurements of offsets, and permitted well-defined limits to be placed on the length and widths of the surface rupture deformation.