Search
Images for Canterbury Earthquake; more images...
Paul on duty at the show
Images, eqnz.chch.2010
File reference: CCL-2011-11-22-378725_10150525003098054_95658493053_10354724_499732666_n PODattheShow November2011 From the collection of Christchurch City Libraries.
Container Love Close-Up
Images, eqnz.chch.2010
Container Love: shipping container decorated with knitted and crocheted squares. Sumner, Christchurch. File reference: CCL-2012-05-12-Around-Sumner-May-2012 DSC_028.JPG From the collection of Christchurch City Libraries.
Container Love Close-Up
Images, eqnz.chch.2010
Container Love: shipping container decorated with knitted and crocheted squares. Sumner, Christchurch. File reference: CCL-2012-05-12-Around-Sumner-May-2012 DSC_032.JPG From the collection of Christchurch City Libraries.
Poseidon Restaurant, Sumner
Images, eqnz.chch.2010
Poseidon Restaurant (currently closed), Sumner, Christchurch File reference: CCL-2012-05-12-Around-Sumner-May-2012 DSC_043.JPG From the collection of Christchurch City Libraries.
Sumner Library
Images, eqnz.chch.2010
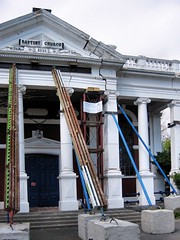
Sumner Library (currently closed), in Sumner, Christchurch File reference: CCL-2012-05-12-Around-Sumner-May-2012 DSC_037.JPG From the collection of Christchurch City Libraries.
Christchurch Hospital Chimney
Images, eqnz.chch.2010
Christchurch Hospital Chimney. File reference: CCL-2012-02-20-CanterburyBrewery-February-2012 DSC_148.JPG From the collection of Christchurch City Libraries.
Paul and Sam Corliss's Street Art Photograph (2009:10:12 01:54:09)
Images, UC QuakeStudies
A photograph of street art at the Addington Saleyards, taken before the Canterbury earthquakes. One of the art works depicts an intoxicated Mickey Mouse.
BeckerFraserPhotos March 2012 photograph 165
Images, UC QuakeStudies
Photograph captioned by BeckerFraserPhotos, "The organ in St Bartholomew's Anglican Church in Kaiapoi, the oldest surviving church in Canterbury. The organ has survived the earthquakes well".
WEMO ERT Set 3 - February 2011 - Photograph 261
Images, UC QuakeStudies
A photograph of the earthquake damage to the Canterbury Television Building on Gloucester Street. Some of the concrete on the columns has crumbled, revealing the steel reinforcement underneath.
Fragility functions for buried pipelines in liquefaction-prone areas based…
Research papers, University of Canterbury Library
Motivation This poster aims to present fragility functions for pipelines buried in liquefaction-prone soils. Existing fragility models used to quantify losses can be based on old data or use complex metrics. Addressing these issues, the proposed functions are based on the Christchurch network and soil and utilizes the Canterbury earthquake sequence (CES) data, partially represented in Figure 1. Figure 1 (a) presents the pipe failure dataset, which describes the date, location and pipe on which failures occurred. Figure 1 (b) shows the simulated ground motion intensity median of the 22nd February 2011 earthquake. To develop the model, the network and soil characteristics have also been utilized.
20100906-153858.jpg
Images, eqnz.chch.2010
None
20100906-121051.jpg
Images, eqnz.chch.2010
None
20100906-121116.jpg
Images, eqnz.chch.2010
None
20100906-123043.jpg
Images, eqnz.chch.2010
None
20100906-123953.jpg
Images, eqnz.chch.2010
None
20100906-123039.jpg
Images, eqnz.chch.2010
None
20100906-120647.jpg
Images, eqnz.chch.2010
None
20100906-122901.jpg
Images, eqnz.chch.2010
None
20100906-123056.jpg
Images, eqnz.chch.2010
None
20100906-154409.jpg
Images, eqnz.chch.2010
None
20100906-121128.jpg
Images, eqnz.chch.2010
None
20100906-123204.jpg
Images, eqnz.chch.2010
None
20100906-120608.jpg
Images, eqnz.chch.2010
None
20100906-154952.jpg
Images, eqnz.chch.2010
None
20100906-155159.jpg
Images, eqnz.chch.2010
None
20100906-155247.jpg
Images, eqnz.chch.2010
None
20100906-113803.jpg
Images, eqnz.chch.2010
None
20100906-114504.jpg
Images, eqnz.chch.2010
None
20100906-155229.jpg
Images, eqnz.chch.2010
None
20100906-113752.jpg
Images, eqnz.chch.2010
None


