
Search
found 919 results
Images for Canterbury; more images...
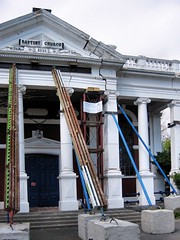
Christchurch earthquake
Images, eqnz.chch.2010
The September Canterbury earthquake. These pictures were taken of Colombo Street in Sydenham. A lot of masonry in this area has been damaged/fallen down. The New Zealand Army, along with Police, were minding the cordons. Note: these photos were taken on a cellphone; mind the quality.
Christchurch earthquake
Images, eqnz.chch.2010
The September Canterbury earthquake. These pictures were taken of The New Zealand Army, along with Police, minding the cordons. This was beside The Press building, and behind the Christchurch Cathedral. Note: these photos were taken on a cellphone; mind the quality.
Christchurch earthquake
Images, eqnz.chch.2010
The September Canterbury earthquake. These pictures were taken of Colombo Street in Sydenham. A lot of masonry in this area has been damaged/fallen down. A second hand dealer store. This is next to Penny Lane which had to relocate down the street. Note: these photos were taken on a cellphone; mind the quality.
Christchurch earthquake
Images, eqnz.chch.2010
The September Canterbury earthquake. These pictures were taken of Colombo Street in Sydenham. A lot of masonry in this area has been damaged/fallen down. The New Zealand Army, along with Police, were minding the cordons. Note: these photos were taken on a cellphone; mind the quality.
Ground Motion Simulation Validation using Small-to-Moderate Magnitude Even…
Research papers, University of Canterbury Library
This poster presents work to date on ground motion simulation validation and inversion for the Canterbury, New Zealand region. Recent developments have focused on the collection of different earthquake sources and the verification of the SPECFEM3D software package in forward and inverse simulations. SPECFEM3D is an open source software package which simulates seismic wave propagation and performs adjoint tomography based upon the spectral-element method. Figure 2: Fence diagrams of shear wave velocities highlighting the salient features of the (a) 1D Canterbury velocity model, and (b) 3D Canterbury velocity model. Figure 5: Seismic sources and strong motion stations in the South Island of New Zealand, and corresponding ray paths of observed ground motions. Figure 3: Domain used for the 19th October 2010 Mw 4.8 case study event including the location of the seismic source and strong motion stations. By understanding the predictive and inversion capabilities of SPECFEM3D, the current 3D Canterbury Velocity Model can be iteratively improved to better predict the observed ground motions. This is achieved by minimizing the misfit between observed and simulated ground motions using the built-in optimization algorithm. Figure 1 shows the Canterbury Velocity Model domain considered including the locations of small-to-moderate Mw events [3-4.5], strong motion stations, and ray paths of observed ground motions. The area covered by the ray paths essentially indicates the area of the model which will be most affected by the waveform inversion. The seismic sources used in the ground motion simulations are centroid moment tensor solutions obtained from GeoNet. All earthquake ruptures are modelled as point sources with a Gaussian source time function. The minimum Mw limit is enforced to ensure good signal-to-noise ratio and well constrained source parameters. The maximum Mw limit is enforced to ensure the point source approximation is valid and to minimize off-fault nonlinear effects.
ELM Offices Level 7 Library - Photograph 30
Images, UC QuakeStudies
University of Canterbury staff members are escorted by Civil Defence members in order to retrieve essential items from their offices. The photographer comments, "E-learning team collect their stuff".
Mechanical Repair Strategy
Articles, UC QuakeStudies
A copy of the mechanical repair strategy for the Townsend Telescope. The strategy was written by Graeme Kershaw, Technician at the University of Canterbury Department of Physics and Astronomy.
SCIRT Collaborative Approach to Global Consenting Framework
Articles, UC QuakeStudies
A copy of the award application which SCIRT, the Christchurch City Council, Environment Canterbury and Beca submitted for the New Zealand Planning Institute Best Practice Award in February 2013.
Christchurch earthquake
Images, eqnz.chch.2010
The September Canterbury earthquake. These pictures were taken of Colombo Street in Sydenham. A lot of masonry in this area has been damaged/fallen down. Ascot TV. This has relocated further south on Colombo Street. Apparently their building on Cranford Street was also severely damaged. Note: these photos were taken on a cellphone; mind the qu...
Christchurch earthquake
Images, eqnz.chch.2010
The September Canterbury earthquake. These pictures were taken of Colombo Street in Sydenham. A lot of masonry in this area has been damaged/fallen down. Angus Donaldson copy service. This has moved down the road on Colombo Street. It is now sharing the premises with Penny Lane Records. Note: these photos were taken on a cellphone; mind the qu...
Observatory Tower Photograph 31
Images, UC QuakeStudies
A photograph of a crack in between the stairway and a column of the Physics Building at the Canterbury Arts Centre. The crack formed during the 22 February 2011 earthquake.
Fragility functions for buried pipelines in liquefaction-prone areas based…
Research papers, University of Canterbury Library
Motivation This poster aims to present fragility functions for pipelines buried in liquefaction-prone soils. Existing fragility models used to quantify losses can be based on old data or use complex metrics. Addressing these issues, the proposed functions are based on the Christchurch network and soil and utilizes the Canterbury earthquake sequence (CES) data, partially represented in Figure 1. Figure 1 (a) presents the pipe failure dataset, which describes the date, location and pipe on which failures occurred. Figure 1 (b) shows the simulated ground motion intensity median of the 22nd February 2011 earthquake. To develop the model, the network and soil characteristics have also been utilized.
Earthquake Commission Chief Executive expenses
Data, data.govt.nz
Disclosure CEO expenses
Christchurch Natural Disaster Response and Recovery presentation
Articles, UC QuakeStudies
A pdf copy of a PowerPoint presentation made for the Water Services Association of Australia conference, about SCIRT's approach to asset investigation after the Canterbury earthquakes of 2010 and 2011.
ELM Offices Level 7 Library - Photograph 26
Images, UC QuakeStudies
University of Canterbury staff members are escorted by Civil Defence members in order to retrieve essential items from their offices. The photographer comments, "ICT network admins, Craig Miller and Aaron Eivers".
ELM Offices Level 7 Library - Photograph 31
Images, UC QuakeStudies
University of Canterbury staff members are escorted by Civil Defence members in order to retrieve essential items from their offices. The photographer comments, "E-learning team vacate their floor. (Blurry, sorry.)
Move to Library Level 5 - Photograph 02
Images, UC QuakeStudies
A member of the University of Canterbury's E-Learning team, Jessica Hollis, in their new office in the James Hight building. The photographer comments, " Jess Hollis settles in to her new workspace".
Simulation of site amplification effects at Heathcote Valley during the 20…
Research papers, University of Canterbury Library
Heathcote Valley school strong motion station (HVSC) consistently recorded ground motions with higher intensities than nearby stations during the 2010-2011 Canterbury earthquakes. For example, as shown in Figure 1, for the 22 February 2011 Christchurch earthquake, peak ground acceleration at HVSC reached 1.4 g (horizontal) and 2 g (vertical), the largest ever recorded in New Zealand. Strong amplification of ground motions is expected at Heathcote Valley due to: 1) the high impedance contrast at the soil-rock interface, and 2) the interference of incident and surface waves within the valley. However, both conventional empirical ground motion prediction equations (GMPE) and the physics-based large scale ground motions simulations (with empirical site response) are ineffective in predicting such amplification due to their respective inherent limitations.
Liquefaction Constitutive Model Validation Using Pore Pressure Records fro…
Research papers, University of Canterbury Library
Well-validated liquefaction constitutive models are increasingly important as non-linear time history analyses become relatively more common in industry for key projects. Previous validation efforts of PM4Sand, a plasticity model specifically for liquefaction, have generally focused on centrifuge tests; however, pore pressure transducers installed at several free-field sites during the Canterbury Earthquake Sequence (CES) in Christchurch, New Zealand provide a relatively unique dataset to validate against. This study presents effective stress site response analyses performed in the finite difference software FLAC to examine the capability of PM4Sand to capture the generation of excess pore pressures during earthquakes. The characterization of the subsurface is primarily based on extensive cone penetration tests (CPT) carried out in Christchurch. Correlations based on penetration resistances are used to estimate soil parameters, such as relative density and shear wave velocity, which affect liquefaction behaviour. The resulting free-field FLAC model is used to estimate time histories of excess pore pressure, which are compared with records during several earthquakes in the CES to assess the suitability of PM4Sand.
Could Base Isolation be an Effective Structural System for NZ Housing?
Research papers, University of Canterbury Library
A significant portion of economic loss from the Canterbury Earthquake sequence in 2010-2011 was attributed to losses to residential buildings. These accounted for approximately $12B of a total $40B economic losses (Horspool, 2016). While a significant amount of research effort has since been aimed at research in the commercial sector, little has been done to reduce the vulnerability of the residential building stock.
Liquidity - After Christchurch Earthquake
Images, eqnz.chch.2010
None
NZi3 - Temporary HQ - Photograph 06
Images, UC QuakeStudies
Temporary office space set up in the NZi3 building. The photographer comments, "University of Canterbury administration all fits into one building! Well, sort of. Looking east from our bay - library and IT people".
UC Restarts - Photograph 21
Images, UC QuakeStudies
One of the tents set up in the Fine Arts car park at the University of Canterbury, used for teaching while lecture theatres were closed for structural testing. The photographer comments, "Temporary lecture tents".
NZi3 - Temporary HQ - Photograph 02
Images, UC QuakeStudies
Members of the University of Canterbury's E-Learning team meet at a staff member's home on Wairakei Road to plan their return to work. The photographer comments, "E-Learning team: Susan Tull, Jess Hollis".
Synthetic study of Full Waveform Seismic Tomography for geophysical veloci…
Research papers, University of Canterbury Library
In this paper we apply Full waveform tomography (FWT) based on the Adjoint-Wavefield (AW) method to iteratively invert a 3-D geophysical velocity model for the Canterbury region (Lee, 2017) from a simple initial model. The seismic wavefields was generated using numerical solution of the 3-D elastodynamic/ visco- elastodynamic equations (EMOD3D was adopted (Graves, 1996)), and through the AW method, gradients of model parameters (compression and shear wave velocity) were computed by implementing the cross-adjoint of forward and backward wavefields. The reversed-in-time displacement residual was utilized as the adjoint source. For inversion, we also account for the near source/ station effects, gradient precondition, smoothening (Gaussian filter in spatial domain) and optimal step length. Simulation-to-observation misfit measurements based on 191 sources at 78 seismic stations in the Canterbury region (Figure 1) were used into our inversion. The inversion process includes multiple frequency bands, starting from 0-0.05Hz, and advancing to higher frequency bands (0-0.1Hz and 0-0.2Hz). Each frequency band was used for up to 10 iterations or no optimal step length found. After 3 FWT inversion runs, the simulated seismograms computed using our final model show a good matching with the observed seismograms at frequencies from 0 - 0.2 Hz and the normalized least-squared misfit error has been significantly reduced. Over all, the synthetic study of FWT shows a good application to improve the crustal velocity models from the existed geological models and the seismic data of the different earthquake events happened in the Canterbury region.
Pleasant Point Yacht Club
Images, eqnz.chch.2010
Badly damaged in both the September and February quakes and over 6000 aftershocks the Point Pleasant yacht club had started to sink into the Avon estuary before being demolished in July 2011 after the June 6.3 earthquake
NZi3 - Temporary HQ - Photograph 20
Images, UC QuakeStudies
Members of the University of Canterbury's E-Learning team in their temporary office in the NZi3 building. The photographer comments, "E-learning group had one bay of desks to work from for 3 weeks".
UC Restarts - Photograph 06
Images, UC QuakeStudies
University of Canterbury ICT staff members prepare to be escorted to buildings by Civil Defence members in order to retrieve computers from offices. The photographer comments, "ICT staff head out to retrieve computers from buildings".
UC Restarts - Photograph 16
Images, UC QuakeStudies
University of Canterbury students walk along University Drive to get to lectures, after most pathways through campus were cordoned off while buildings were structurally tested. The photographer comments, "Lawns beside University Drive became main walkways".
Key Parmeters in Pre-Event Data Collection for Emergency Response and Seis…
Research papers, University of Canterbury Library
Abstract This study provides a simplified methodology for pre-event data collection to support a faster and more accurate seismic loss estimation. Existing pre-event data collection frameworks are reviewed. Data gathered after the Canterbury earthquake sequences are analysed to evaluate the relative importance of different sources of building damage. Conclusions drawns are used to explore new approaches to conduct pre-event building assessment.