
A page banner promoting an article about visitors avoiding the South Island.

A map showing the route of the Red Zone bus tour.

An infographic explaining the structure and funcion of the Canterbury Earthquake Recovery Authority (CERA).

A graphic comparing spending in the Boxing Day and 'Boxing Day replay' sales.

A graphic giving statistics on EQC claims.

Illustrations of types of inner-city housing.

A list of recently released casualities of the 22 February 2011 earthquake.

A infographic giving the status of large buildings in the central city.

A page banner promoting an article titled, 'Saturday's 5.2'.

A page banner promoting an article titled, "Cardboard cathedral?".

A map showing the airport noise contour relative to residential developments in Kaiapoi.

Graphs comparing residential property prices across Christchurch and New Zealand.

A graphic for a feature titled, "Six months on".

A chart showing the status of rest home residents evacuated following the 22 February 2011 earthquake.

A word cloud with terms relating to the Christchurch rebuild.

A map showing the voting pattern for the Christchurch Central electorate.

A map of the proposed Peterborough village.

A map showing the airport noise contour relative to residential developments in Kaiapoi.

A map showing the location of fault lines.

A map showing the location of buildings given urgent status by CERA.

A cartoon about City Care operating in the Red Zone.

A graph forecasting business growth.
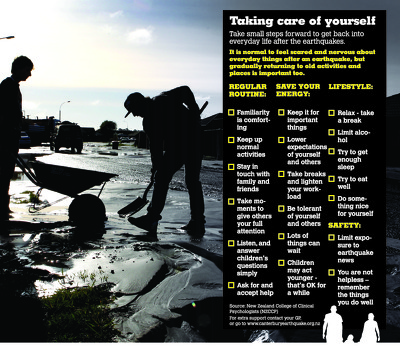
An infographic giving tips on dealing with earthquake-related stress.

A page layout for the contents page of the Your Weekend section of The Press.

Graphs comparing residential property prices across Christchurch and New Zealand.

A page banner advertising a feature titled, 'Street art: Christchurch's outdoor gallery'.

A graphic describing a drilling operation to investigate the Alpine Fault.

A banner reading, 'The Big Quake, Canterbury, September 4, 2010'.

A map showing the location and magnitudes of aftershocks in a morning.

A time-line titled, 'The road to recovery'.