
A graphic showing cruise ships in Akaroa harbour.

An infographic showing the proposed Addington City Stadium.

A graphic showing the cost of the earthquakes.

A page layout for the "Faultlines" special report.

A chart showing the status of EQC claims.
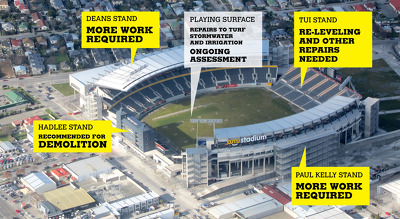
An infographic showing the status of AMI Stadium.

A graphic giving crime rate statistics for Canterbury.

A chart giving statistics for earthquake-related injuries.

An infographic charting aftershocks on 11 March 2011.

A graphic giving information about the Transitional Cathedral.

A page banner promoting articles about the rebuild.

A map showing the locations of building demolitions.

A map showing the location of proposed subdivisions.
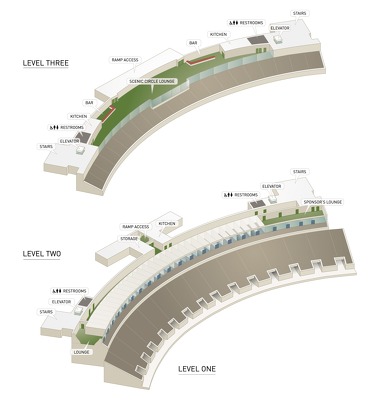
An infographic showing the layout of AMI Stadium.

A chart showing EQC payments in South Canterbury.

A page layout for the "Faultlines" special report.

A compliation of photographs of Mayor Bob Parker.

The logo for a series titled, "Quake insurance".

A page banner with images from the earthquake.
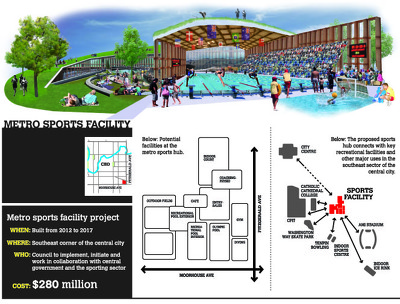
An infographic showing the proposed Metro Sports Facility.

A photoshopped photograph of earthquake victim Pamela Barkle.

Photograph captioned by Fairfax, "Press conference with Rob Saunders of the fire service and Al Stewart for the police".

A graphic showing changes in Christchurch's energy use.

A graphic giving statistics on the Christchurch rebuild.

An infographic showing the status of Christchurch schools.

An infographic illustrating an accountability scorecard given to the Christchurch City Council.

An incomplete graphic illustrating quotes from business leaders about the Christchurch CBD.

A graphic showing measures to be taken to increase housing in Christchurch.

A graph showing Christchurch City Council's projected debt.

Graphs showing the performance of Christchurch International Airport.