
A graph comparing the Christchurch price index to the New Zealand index.

A graph showing the effect the 4 September 2010 earthquake had on investor confidence in Christchurch.

A map showing the extent of liquefaction caused by the 4 September 2010 and 22 February 2011 earthquakes.

A page banner promoting an article titled, "Rebuild debate".

An infographic describing the Department of Building and Housing guidelines for foundations on TC3 land.

A graphic promoting a discussion on press.co.nz of an article about Mayor Bob Parker accepting Earthquake Minister Gerry Brownlee's apology for calling him a 'clown'.

An infographic about the Israelis who died in the 22 February 2011 earthquake.

A map showing the locations of arsons in the eastern suburbs.

A graph showing changes in green-zoned property prices.

The front page graphic for The Press, featuring an article about the dispute over the demolition of ChristChurch Cathedral.

A compliation of photographs of Mayor Bob Parker.

A map showing proposed changes to speed limits on roads in the central city.

An infographic giving the status of Canterbury District Health Board mental regional hospitals.

An advertisement calling for stories about people affected by the 4 September earthquake.

A map showing changes in the red zone cordon.

Graphs showing people's expectations for the future.

A page banner promoting an article about tourist activities in Christchurch.
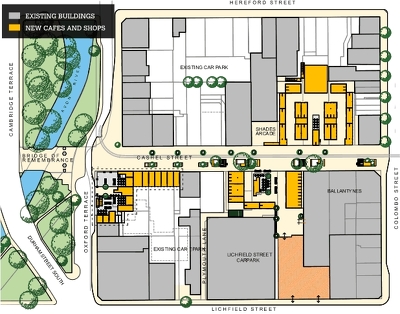
An infographic showing the layout of City Mall.

A graphic giving information about memorial services marking the anniversary of the 22 February 2011 earthquake.

The logo for a series titled, "Quake insurance".

An infographic listing the ten global cities to watch.

A graphic giving statistics on EQC claims.

An infographic showing the status of houses in Southshore.

An infographic showing the new magnitude scale being used by Geonet Rapid.

A page banner listing earthquake-related articles.

Page banner for the "Faultlines" special report.

A page banner promoting an article about ChristChurch Cathedral.

A map showing road closures in the central city.

A page banner with images from the earthquake.

A page banner promoting an article about recovery in Japan following the 2011 earthquake and tsunami.