
Graphs comparing residential property prices across Christchurch and New Zealand.

A graph showing annual house value growth in Canterbury.
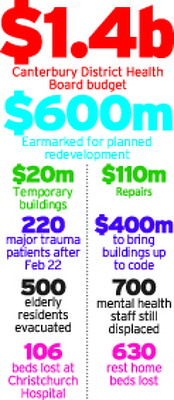
A graphic giving statistics about the Canterbury District Health Board.

A timeline of events in the year since the 22 February 2011 earthquake.

A page banner promoting an article titled, "Leaving town".

A page banner promoting an article about flooding in the eastern suburbs.

An infographic showing the growth in staff numbers at CERA.

A graphic showing the damage to ChristChurch Cathedral.

A chart showing EQC payments in South Canterbury.

A partially-completed map showing the locations of demolished and condemned buildings.

An advertisement for 'The Big Quake', a book about the 4 September earthquake produced by The Press. The advertisement advises that the book has sold out and is being reprinted.

A list of newly released casualities of the 22 February 2011 earthquake.

A graph breaking down projected government spending on earthquake recovery.

A graphic for a feature titled, "5 Canterbury acts you should know about".

A front page graphic for the Christchurch Mail, marking the anniversary of the 22 February 2011 earthquake.

A map showing the access route to the Rendezvous Hotel.

A chart showing the results of a poll, comparing responses from Canterbury to those from the rest of New Zealand.

A map showing the location and magnitude of aftershocks.

A graphic showing work done by volunteers in order to earn tickets to The Concert.

A chart comparing crime rates in Riccarton, Addington and Hornby.

An advertisement for a reprint of the 6 September edition of The Press.

A map of the CBD cordons, showing expected dates for the cordon to be reduced.

An infographic showing the location of malls built from shipping containers.

The front page graphic for the Your Weekend section of The Press. The main headline reads, "Hope: Roger Sutton takes charge of Christchurch".

An infographic showing wartime tunnels found under the Lyttelton Time Ball Station.

A page banner promoting an article titled, 'What can we learn from California?'.

A graphic for a feature titled, "Red zone countdown".

Graphs showing the effect of the earthquakes on energy use.

A page layout for the "Faultlines" special report.

An incomplete infographic listing multi-storey buildings of concern in the CBD.