
A graph showing the result of a poll of satisfaction among Red and Green Zone residents.

A map showing the location of buildings given urgent status by CERA.

A graphic showing the cost of infrastructure repairs across the city.
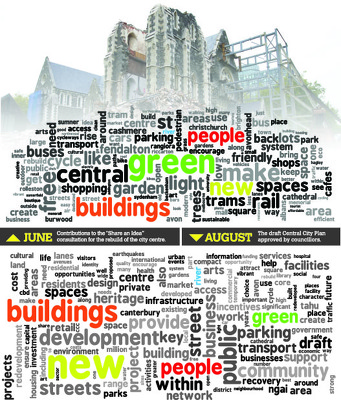
Word clouds comparing the draft Central City Plan to Share an Idea contributions.

A page banner promoting a feature on aerial photographs of Christchurch.

A map showing the proposed location for a red-light district.

A page banner promoting an article about progress two months on from the 4 September 2010 earthquake.

A chart showing the drop in public transport patronage following the earthquakes.

A map showing newly Green-Zoned properties in the Port Hills.

A page banner promoting articles about the use of social networks in Canterbury and about the demolition of Cranmer Courts.

A page banner promoting an article titled, "Alice's opens new cinema".

A list of newly released casualities of the 22 February 2011 earthquake.

An incomplete graphic showing zones of damage in Brooklands, Spencerville, and Pines and Kairaki Beach.

An infographic comparing the costs of red-zoning and remediating land.

An infographic comparing statements by Mayor Bob Parker and Sir Bob Jones.

A map showing the location of a historic rupture of the Alpine Fault.

A map showing the possible location of a fault line below Christchurch.

A graph comparing enrolments at early childhood centres in 2010 and 2011.

A photoshopped image of a cross being lifted by a crane.

A full-page infographic listing the victims of the 22 February 2011 earthquake.

A map showing the route of the Red Zone bus tour.

A page banner promoting an article titled, "Past and present".

A page banner promoting an article titled, "Message in a bottle".

An uncompleted page layout with a map showing the locations of damaged buildings.

An infographic comparing property prices across New Zealand.

A map showing the location and magnitude of an aftershock 10km east of Lyttelton.

A page banner promoting articles about the Christchurch rebuild.

A page banner promoting a feature about lessons to be learnt from San Francisco.

A graphic showing how much material from tall building demolitions is recycled.

A graphic promoting a poll asking for opinions on a proposed stadium design.