Search
found 6322 results
Images for Canterbury earthquakes; more images...

A Tale of Two Suburbs: Earthquake recovery and civil society in Christchur…
Research papers, University of Canterbury Library
This study followed two similarly affected, but socio-economically disparate suburbs as residents responded to and attempted to recover from the devastating 6.3 magnitude earthquake that struck Christchurch, New Zealand, on February 22, 2011. More specifically, it focuses on the role of local churches, community-based organisations (CBOs) and non-governmental organisations (NGOs), here referred to broadly as civil society, in meeting the immediate needs of local residents and assisting with the longer-term recovery of each neighbourhood. Despite considerable socioeconomic differences between the two neighbourhoods, civil society in both suburbs has been vital in addressing the needs of locals in the short and long term following the earthquake. Institutions were able to utilise local knowledge of both residents and the extent of damage in the area to a) provide a swifter local response than government or civil defence and then help direct the relief these agencies provided locally; b) set up central points for distribution of supplies and information where locals would naturally gather; c) take action on what were perceived to be unmet needs; and d) act as a way of bridging locals to a variety of material, informational, and emotional resources. However the findings also support literature which indicates that other factors are also important in understanding neighbourhood recovery and the role of civil society, including: local leadership; a shared, place-based identity; the type and form of civil society organizations; social capital; and neighbourhood- and household-level indicators of relative vulnerability and inequality. The intertwining of these various factors seems to influence how these neighbourhoods have coped with and taken steps in recovering from this disaster. It is recommended that future research be directed at developing a better understanding of how this occurs. It is suggested that a model similar to Yasui’s (2007) Community Vulnerability and Capacity model be developed as a useful way to approach future research in this area.
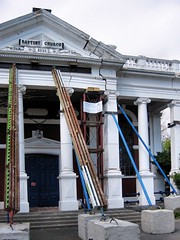
Nisbet, Alistair, 1958- :Spongebob Mayorpants. 29 December 2011
Images, Alexander Turnbull Library
Cartoon showing Mayor Bob Parker as 'Spongebob Mayorpants'. Describes the mayor as often getting into deep water, soft and resilient and able to soak up criticism, bouncing back when under pressure. There has been concern and criticism about problems within the city council that effect thr rebuilding of Christchurch. Quantity: 1 digital cartoon(s).
Nisbet, Alastair, 1958- :Rates quake. 28 June 2012
Images, Alexander Turnbull Library
Shows an earthquake in Christchurch. A large notice reads 'Bob's wishlist to justify Chch rates hike'. 'Bob' is Bob Parker the Mayor of Christchurch. Context: Refers to an Order in Council to give Christchurch City Council more flexibility in setting rates. Cr Yani Johanson sought to grant 100 per cent rates relief for residents who had been unable to occupy their homes during the 2011-12 financial year because of the city's earthquakes - a proposal which staff said would cost $4.9 million - this proposal was voted down. Quantity: 1 digital cartoon(s).
Rangiora Express
Audio, Radio New Zealand
One of the great community initiative's in Canterbury is the Rangiora Earthquake Express - where urgent help is still needed. These Rangiora volunteers have been up and running for sometime now, with daily runs into the Christchurch suburbs most desperately in need of water and other essential supplies.
20160307_6634_7D2-82 Really Wild!
Images, eqnz.chch.2010
A section of retaining wall that tilted in the Christchurch 2011 earthquake. At the Edmunds Band Rotunda sight. Still not repaired,
Monitoring land cover change with LiDAR and aerial imagery in Christchurch…
Research papers, University of Canterbury Library
Land cover change information in urban areas supports decision makers in dealing with public policy planning and resource management. Remote sensing has been demonstrated as an efficient and accurate way to monitor land cover change over large extents. The Canterbury Earthquake Sequence (CES) caused massive damage in Christchurch, New Zealand and resulted in significant land cover change over a short time period. This study combined two types of remote sensing data, aerial imagery (RGB) and LiDAR, as the basis for quantifying land cover change in Christchurch between 2011 – 2015, a period corresponding to the five years immediately following the 22 February 2011 earthquake, which was part of the CES. An object based image analysis (OBIA) approach was adopted to classify the aerial imagery and LiDAR data into seven land cover types (bare land, building, grass, shadow, tree and water). The OBIA approach consisted of two steps, image segmentation and object classification. For the first step, this study used multi-level segmentation to better segment objects. For the second step, the random forest (RF) classifier was used to assign a land cover type to each object defined by the segmentation. Overall classification accuracies for 2011 and 2015 were 94.0% and 94.32%, respectively. Based on the classification result, land cover changes between 2011 and 2015 were then analysed. Significant increases were found in road and tree cover, while the land cover types that decreased were bare land, grass, roof, water. To better understand the reasons for those changes, land cover transitions were calculated. Canopy growth, seasonal differences and forest plantation establishment were the main reasons for tree cover increase. Redevelopment after the earthquake was the main reason for road area growth. By comparing the spatial distribution of these transitions, this study also identified Halswell and Wigram as the fastest developing suburbs in Christchurch. These results provided quantitative information for the effects of CES, with respect to land cover change. They allow for a better understanding for the current land cover status of Christchurch. Among those land cover changes, the significant increase in tree cover aroused particularly interest as urban forests benefit citizens via ecosystem services, including health, social, economic, and environmental benefits. Therefore, this study firstly calculated the percentages of tree cover in Christchurch’s fifteen wards in order to provide a general idea of tree cover change in the city extent. Following this, an automatic individual tree detection and crown delineation (ITCD) was undertaken to determine the feasibility of automated tree counting. The accuracies of the proposed approach ranged between 56.47% and 92.11% in thirty different sample plots, with an overall accuracy of 75.60%. Such varied accuracies were later found to be caused by the fixed tree detection window size and misclassifications from the land cover classification that affected the boundary of the CHM. Due to the large variability in accuracy, tree counting was not undertaken city-wide for both time periods. However, directions for further study for ITCD in Christchurch could be exploring ITCD approaches with variable window size or optimizing the classification approach to focus more on producing highly accurate CHMs.
Observatory Tower Photograph 36
Images, UC QuakeStudies
A photograph of the platform for the Townsend Telescope amongst the rubble of the Observatory tower at the Christchurch Arts Centre. The tower collapsed during the 22 February 2011 earthquake, severely damaging the telescope.
Empowered Christchurch Letter to Gerry Brownlee 2
Articles, UC QuakeStudies
A copy of a letter from Empowered Christchurch which was sent to Gerry Brownlee, Minsiter for the Canterbury Earthquake Recovery, on 15 April 2014. The letter lodges an Official Information Act request about Imminent Loss claims settled by the EQC since September 2010.
Christchurch Press Image: John Kirk-Anderson 2010:10:21 11:23:14
Images, UC QuakeStudies
Photograph captioned by Fairfax, "Newly married couple Jill Tyquin-Smith and Arthur Smith of Rangiora, who decided to get married after the Canterbury earthquake so they could live together. They organised the wedding in two weeks and are now living happily ever after".
Christchurch Press Image: John Kirk-Anderson 2010:10:21 11:23:56
Images, UC QuakeStudies
Photograph captioned by Fairfax, "Newly married couple Jill Tyquin-Smith and Arthur Smith of Rangiora, who decided to get married after the Canterbury earthquake so they could live together. They organised the wedding in two weeks and are now living happily ever after".
Christchurch Press Image: John Kirk-Anderson 2010:10:21 11:16:48
Images, UC QuakeStudies
Photograph captioned by Fairfax, "Newly married couple Jill Tyquin-Smith and Arthur Smith of Rangiora, who decided to get married after the Canterbury earthquake so they could live together. They organised the wedding in two weeks and are now living happily ever after".
Christchurch Press Image: John Kirk-Anderson 2010:10:21 11:23:50
Images, UC QuakeStudies
Photograph captioned by Fairfax, "Newly married couple Jill Tyquin-Smith and Arthur Smith of Rangiora, who decided to get married after the Canterbury earthquake so they could live together. They organised the wedding in two weeks and are now living happily ever after".
Christchurch Press Image: John Kirk-Anderson 2010:10:21 11:16:19
Images, UC QuakeStudies
Photograph captioned by Fairfax, "Newly married couple Jill Tyquin-Smith and Arthur Smith of Rangiora, who decided to get married after the Canterbury earthquake so they could live together. They organised the wedding in two weeks and are now living happily ever after".
Image - Feeding the Multitudes
Images, UC QuakeStudies
An image from a Navy Today April 2011 article titled, "Feeding the Multitudes". The image is of CPOCH Perrin Newland head chief of the HMNZS Canterbury which moored in Lyttelton after the 22 February 2011 earthquake, supplying meals to the Lyttelton community.
Engaging Quake Claimants and Community Networks - Address by Brian Parker
Videos, UC QuakeStudies
A video of an address by Brian Parker, Project Manager of Canterbury Communities' Earthquake Recovery Network (CanCERN) and Managing Director of Sharp Teaching, at the 2015 Seismics and the City forum. This talk is about learning from complex claims and local knowledge.
Image 4 - Defence Medical Personnel Use Their Expertise
Images, UC QuakeStudies
An image from a Army News March 2011 article titled, "Defence Medical Personnel Use Their Expertise". In this image, Royal New Zealand Air Force personnel are carrying a rest home resident onto a Hercules C-130 for evacuation following the Canterbury Earthquake.
Fairfax Media Auckland Bureau Image: John Selkirk 2010:10:04 20:20:28
Images, UC QuakeStudies
Photograph captioned by Fairfax, "The Canterbury Earthquake Business Benefit Dinner hosted by the Prime Minister, was held tonight at Sky City in Auckland. Shown at the dinner is Auckland Supercity mayoral candidate Len Brown (left) with Bill Highet the retail GM at Meridian".
Christchurch Mail Image: John Bisset 2010:09:10 14:22:22
Images, UC QuakeStudies
Photograph captioned by Fairfax, "Members of the Red Cross civil defence response team and South Canterbury Police have been in Christchurch helping with the earthquake clean up. Having a look at a damaged bridge on River Road near Tai Tapu is Anna Sole".
All Right? Events: Summer of Fun Bubble Mixture Label
Articles, UC QuakeStudies
A PDF copy of a bubble mixture label with instructions for making bubble mix. The labels were created for the Summer of Fun, a series of fun days held around Christchurch supported by CERA, the Canterbury Earthquake Appeal Trust, SKIP and All Right?.
Christchurch Press Image: John Kirk-Anderson 2010:10:21 11:23:44
Images, UC QuakeStudies
Photograph captioned by Fairfax, "Newly married couple Jill Tyquin-Smith and Arthur Smith of Rangiora, who decided to get married after the Canterbury earthquake so they could live together. They organised the wedding in two weeks and are now living happily ever after".
Deans Homestead October 2008
Images, eqnz.chch.2010
20081011_1524_1D3-45 Deans Homestead October 2008 The historic Deans Homestead 23 months ago. Now destroyed in the Canterbury earthquake of September 4th 2010. This photo was taken on the PSNZ 2008 Southern Regional Photographic Convention bus trip. #384
Seismic Anisotropy and Stress of the Canterbury Plains
Research papers, Victoria University of Wellington
The Mѡ=7.1 Darfield (Canterbury) earthquake struck on 4 September 2010, approximately 45 km west of Christchurch, New Zealand. It revealed a previously unknown fault (the Greendale fault) and caused billions of dollars of damage due to high peak ground velocities and extensive liquefaction. It also triggered the Mw=6.3 Christchurch earthquake on 22 February 2011, which caused further damage and the loss of 185 lives. The objective of this research was to determine the relationship between stress and seismic properties in a seismically active region using manually-picked P and S wave arrival times from the aftershock sequence between 8 September 2010-13 January 2011 to estimate shear-wave splitting (SWS) parameters, VP =VS-ratios, anisotropy (delay-time tomography), focal mechanisms, and tectonic stress on the Canterbury plains. The maximum horizontal stress direction was highly consistent in the plains, with an average value of SHmax=116 18 . However, the estimates showed variation in SHmax near the fault, with one estimate rotating by as much as 30° counter-clockwise. This suggests heterogeneity of stress at the fault, though the cause remains unclear. Orientations of the principal stresses predominantly indicate a strike-slip regime, but there are possible thrust regimes to the west and north/east of the fault. The SWS fast directions (ø) on the plains show alignment with SHmax at the majority of stations, indicating stress controlled anisotropy. However, structural effects appear more dominant in the neighbouring regions of the Southern Alps and Banks Peninsula.
Resilience and Agility in Response to the Canterbury Quakes: Some case stu…
Videos, UC QuakeStudies
A video of the first part of an address by Dr. John Vargo from the UC branch of Resilient Organisations, at the 2012 Seismics and the City forum. The talk covers case studies from the Canterbury Earthquakes, which shed light on the ingredients of a resilient organisational culture and best business practices for enhancing resilience.
Resilience and Agility in Response to the Canterbury Quakes: Some case stu…
Videos, UC QuakeStudies
A video of the second part of an address by Dr. John Vargo from the UC branch of Resilient Organisations, at the 2012 Seismics and the City forum. The talk covers case studies from the Canterbury Earthquakes, which shed light on the ingredients of a resilient organisational culture and best business practices for enhancing resilience.
No apology for family of Canterbury quake victim, 10 years on
Audio, Radio New Zealand
Matthew McEachen should have had most of his life ahead of him when he died on February 22, 2011. The 25-year-old was a talented artist and designer, putting his skills to good use at the Southern Ink tattoo shop on Colombo St. But when the earthquake struck, Bruce, Jeanette and Sarah McEachen lost their much-loved son and older brother. Ten years on, Matti's legacy lives on. Checkpoint reporter Nick Truebridge and cameraman Nate McKinnon with his story.
Development of deep Vs profiles and site periods for the Canterbury region
Research papers, University of Canterbury Library
Recent field investigations were carried out to define the shear wave velocity (VS) profile and site periods across the Canterbury region, supplementing earlier efforts in urban Christchurch. Active source surface wave testing, ambient wave field (passive) and H/V spectral ratio methods were used to characterise the soil profile in the region. H/V spectral ratio peaks indicate site periods in the range of 5-7 seconds across much of the Canterbury Plains, broadly consistent with those based on a 1D velocity model for the region. Site periods decrease rapidly in the vicinity of the Canterbury foothills and the Banks Peninsula outcrops. In Christchurch, the Riccarton Gravels result in a significant mode of vibration that has a much shorter period than the site period of the entire soil column down to basement rock.
RESEARCH BRIEFING ON EQC IN THE PRESS
Research papers, University of Canterbury Library
This research briefing reports on the key findings of a computer-assisted text analysis of records from The Press newspaper related to the Earthquake Commission (EQC) from 2010 to 2019. The briefing has been prepared as a submission to the Public Inquiry into the Earthquake Commission. The aim of producing this research briefing is to provide the Public Inquiry with preliminary findings of a large-scale overview of media coverage on EQC and to identify and quantify key features and trends in public discourse about EQC over time. This research, which aggregates many stories and voices over time, offers a unique lens to view how EQC has been collectively represented, understood and experienced by the people of Canterbury.
Nisbet, Alastair, 1958- :New warning system for Christchurch? 24 July 2012
Images, Alexander Turnbull Library
Shows a new warning system in Christchurch that consists of the heads of Gerry Brownlee, Canterbury Earthquake Recovery Minister, the Mayor of Christchurch Bob Parker and CERA CEO Roger Sutton. Each bellows his particular mantra. Context: Christchurch's new tsunami warning system will be tested on Sunday 22 July at 11am for one to two minutes. Quantity: 1 digital cartoon(s).
Preliminary insights into the fault geometries and kinematics of surface r…
Research papers, University of Canterbury Library
The south Leader Fault (SLF) is a newly documented active structure that ruptured the surface during the Mw 7.8 Kaikoura earthquake. The Leader Fault is a NNE trending oblique left lateral thrust that links the predominantly right lateral ‘The Humps’ and Conway-Charwell faults. The present research uses LiDAR at 0.5 m resolution and field mapping to determine the factors controlling the surface geometries and kinematics of the south Leader Fault ruptures at the ground surface. The SLF zone is up to 2km wide and comprises a series of echelon NE-striking thrusts linked by near-vertical N-S striking faults. The thrusts are upthrown to the west by up to 1 m and dip 35-45°. Thrust slip surfaces are parallel with Cretaceous-Cenozoic bedding and may reflect flexural slip folding. By contrast, the northerly striking faults dip steeply (65° west- 85° east), and accommodate up to 3m of oblique left lateral displacement at the ground surface and displace Cenozoic bedding. Some of the SLF has been mapped in bedrock, although none were known to be active prior to the earthquake or have a strong topographic expression. The complexity of fault rupture and the width of the fault zone appears to reflect the occurrence of faulting and folding at the ground surface during the earthquake.
Nisbet, Alistair, 1958- :The REAL Christchurch buskers... 19 January 2012
Images, Alexander Turnbull Library
Aspects of Christchurch life after the earthquakes of 2010 and 2011, modelled on acts performed at the Buskers' Festival being held in Christchurch. Include `Silt walking'through liquefaction; 'Orange zone', representing the paralysis of homeowners whose properties were classified as 'orange', or of undecided status; 'Jugglers "Marryatt" and "Red Zone"': the Christchurch CEO, Tony Marryatt, juggles with money, his large pay rise, while the red-zoned householder juggles with unattractive options; 'The boy [CBD] with red tape all over him', referring to the cordon which was strangling the Central Business District; the columnist Joe Bennett with his dog, refusing to move from his house in Lyttelton, a cause celebre of resistance to the earthquake authorities in those days. Quantity: 1 digital cartoon(s).